
If you haven’t already, be sure to check out my prior pages, where I condition the signals referenced here in MATLAB here. If you are not familiar with DSP, then I offer this reference.
MATLAB is a powerful mathematical analysis tool, and I plan to use it to evaluate and examine recorded EEG signals to determine the impact that cellular and other man-made signals have on the brain. Although this has already been determined through other legit scientific studies recently released (another) I wish to perform my own study as an introductory for me into this science.
The basics of signal analysis
I have started learning about Digital Signal Analysis, and have created a small tutorial that proves my method of extracting the frequencies found within a signal functions as expected. In my example, I will create a 1Hz sinewave with an amplitude of 1, phase of 0 degrees, and based on a 250Hz sampling, and then I will use the FFT function to extract the frequencies found within. Using the MATLAB script below, in a new script and clean workspace, I created a sine wave consisting of a 1Hz and 5Hz signal:
| %Wave properties w1=1; % Frequency1 (Hz) A1=2; % Amplitude1 (dimensionless) w2=5; % Frequency2 (Hz) A2=3; % Amplitude2 (dimensionless) % Time properties Datapoints = 1000; % Number of recorded data; Length=10;% Length (seconds); Step= Length/Datapoints; % Fraction of seconds t = (0:Datapoints-1)*Step; % Time vector % Sum of a w1-Hz sinusoid and a w2-Hz sinusoid y = A1*sin(2*pi*w1*t) + A2*sin(2*pi*w2*t); |  |
We will plot a single-sided amplitude spectrum of the generated sine wave:
| % Plot single-sided amplitude spectrum plot(f,2*abs(Y(1:NFFT/2+1))) axis([0 6 0 6]) title(‘Single-Sided Amplitude Spectrum of y(t)’) xlabel(‘Frequency (Hz)’) ylabel(‘Amplitude – |Y(f)|’) | 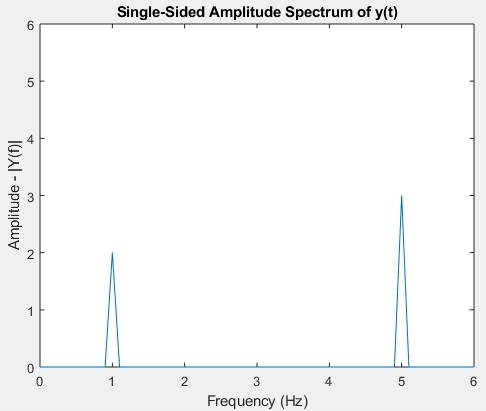 |
Now we will determine the frequencies that make up the signal using the following code below:
| % Fourier Transformation NFFT = Datapoints; Y = fft(y,NFFT)/Datapoints; fs=Datapoints/Length; f = fs/2*linspace(0,1,NFFT/2+1); [B,IX] = sort(2*abs(Y(1:NFFT/2+1))); BFloor=0.1; Amplitudes=B(B>=BFloor) Frequencies=f(IX(1+end-numel(Amplitudes):end)) | 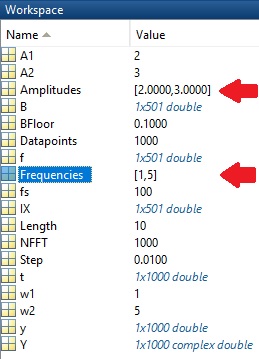 |
As can be seen above two results are found: 1Hz with amplitude 2, and 5Hz with amplitude of 3. If noise is a problem, then it can be filtered out by adjusting the BFloor constant to a higher number.
Signal Analysis
I wanted to compare the frequency components between P8 and T8. I loaded back in my workspace, and ran the below code. As can be seen there were some similarities between them.
| % Determine the frequencies T=1/fs; t = (0:row_count-1)*T; % Change S and S1 to the signals you wish to compare S = P8_Filtered; S1 = T8_Filtered;Y = fft(S); P2 = abs(Y/row_count); P1 = P2(1:row_count/2+1); P1(2:end-1) = 2*P1(2:end-1); f = fs*(0:(row_count/2))/row_count; plot(f,P1); hold on Y = fft(S1); P4 = abs(Y/row_count); P3 = P4(1:row_count/2+1); P3(2:end-1) = 2*P3(2:end-1); f = fs*(0:(row_count/2))/row_count; plot(f,P3); | 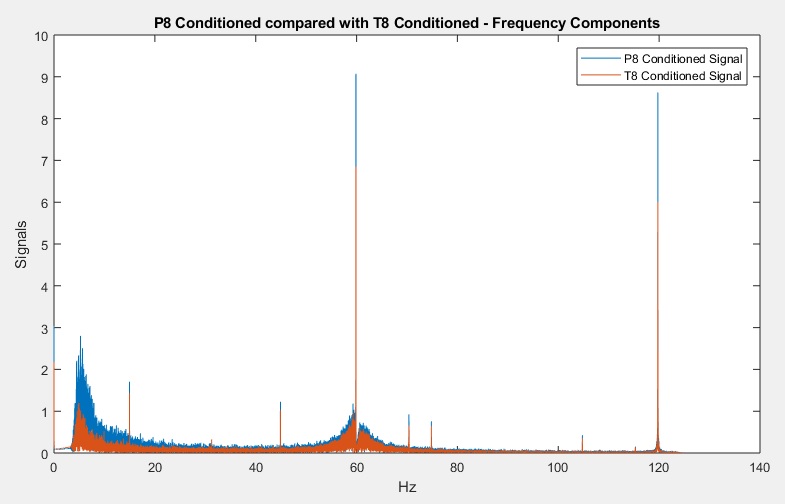 |
I wanted to see what frequencies can be found within C3. I plotted the result using the code below. As can be seen, there were a lot of them – MATLAB counted 140 of them. Note that adjusting the floor changes the number of signals found.
| % Fourier Transformation NFFT = row_count; Y = fft(C3_Filtered,NFFT)/row_count; f = fs/2*linspace(0,1,NFFT/2+1); % Plot single-sided amplitude spectrum plot(f,2*abs(Y(1:NFFT/2+1))) title(‘Single-Sided Amplitude Spectrum of y(t)’) xlabel(‘Frequency (Hz)’) ylabel(‘Amplitude – |Y(f)|’)[B,IX] = sort(2*abs(Y(1:NFFT/2+1))); BFloor=0.5; Amplitudes=B(B>=BFloor) Frequencies=f(IX(1+end-numel(Amplitudes):end)) | 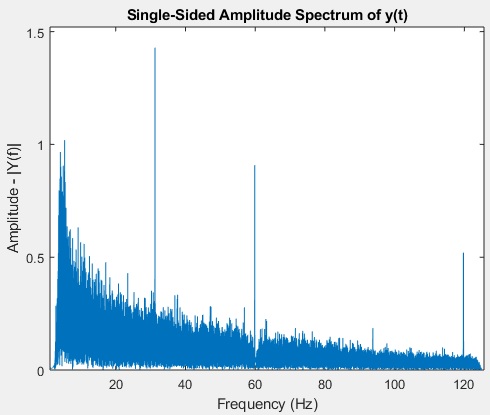 |
My goal is to work towards gaining an understanding of which frequencies are common to the various areas of the brain and determining their phase (to see if they are synchronized). I decided to compare the signals found during my EEG recording between C3 and C4. The following code will generate two variables, each containing a list of the frequencies found in each of the signals, rounded to one decimal place.
| % Fourier Transformation of C3 NFFT = row_count; Y = fft(C3_Filtered,NFFT)/row_count; f = fs/2*linspace(0,1,NFFT/2+1); % Extract the frequencies [B,IX] = sort(2*abs(Y(1:NFFT/2+1))); BFloor=0.5; Amplitudes_C3=B(B>=BFloor); Frequencies_C3=f(IX(1+end-numel(Amplitudes_C3):end)); % Fourier Transformation of C4 NFFT = row_count; Y = fft(C4_Filtered,NFFT)/row_count; f = fs/2*linspace(0,1,NFFT/2+1); % Extract the frequencies [B,IX] = sort(2*abs(Y(1:NFFT/2+1))); BFloor=0.5; Amplitudes_C4=B(B>=BFloor); Frequencies_C4=f(IX(1+end-numel(Amplitudes_C4):end)); % Build the variables and condition the frequencies Frequencies_C3_Rounded = round(Frequencies_C3,1); Frequencies_C4_Rounded = round(Frequencies_C4,1); Frequencies_C3_Rounded_Sorted = sort(Frequencies_C3_Rounded); Frequencies_C4_Rounded_Sorted = sort(Frequencies_C4_Rounded); % Plot the results plot(Frequencies_C3_Rounded_Sorted) hold on plot(Frequencies_C4_Rounded_Sorted) | 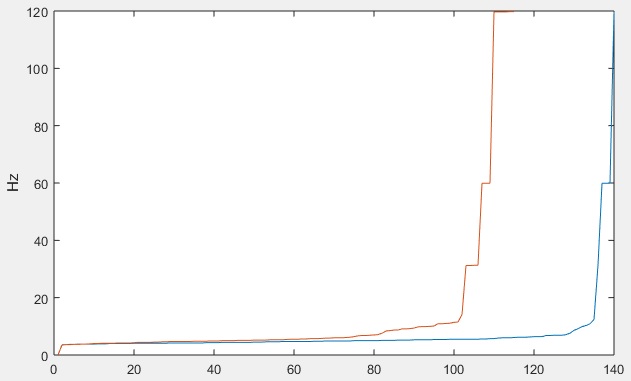 |
It is interesting that many frequencies were duplicated. So I expanded the investigation to include all of the unique frequencies found in each of the signals, and decided to sort them so it would be easier to compare them. I wrote a MATLAB script to create the necessary variables – the program was broke into 4 blocks below (for space). I’ll improve the script later.
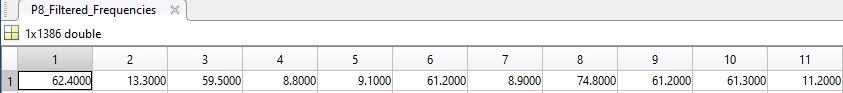
| for x = 1:16 if x == 1 EEG_Signal = C3_Filtered; elseif x == 2 EEG_Signal = C4_Filtered; elseif x == 3 EEG_Signal = F3_Filtered; elseif x == 4 EEG_Signal = F4_Filtered; elseif x == 5 EEG_Signal = F7_Filtered; elseif x == 6 EEG_Signal = F8_Filtered; elseif x == 7 EEG_Signal = Fp1_Filtered; elseif x == 8 EEG_Signal = Fp2_Filtered; elseif x == 9 EEG_Signal = O1_Filtered; elseif x == 10 EEG_Signal = O2_Filtered; elseif x == 11 EEG_Signal = P3_Filtered; elseif x == 12 EEG_Signal = P4_Filtered; elseif x == 13 EEG_Signal = P7_Filtered; elseif x == 14 EEG_Signal = P8_Filtered; elseif x == 15 EEG_Signal = T7_Filtered; elseif x == 16 EEG_Signal = T8_Filtered; end | NFFT = row_count; Y = fft(EEG_Signal,NFFT)/row_count; f = fs/2*linspace(0,1,NFFT/2+1); [B,IX] = sort(2*abs(Y(1:NFFT/2+1))); BFloor=0.5; amplitude_variable=B(B>=BFloor); variable=f(IX(1+end-numel(amplitude_variable):end)); | if x == 1 C3_Filtered_Frequencies = unique(sort(round(variable,1))); elseif x == 2 C4_Filtered_Frequencies = unique(sort(round(variable,1))); elseif x == 3 F3_Filtered_Frequencies = unique(sort(round(variable,1))); elseif x == 4 F4_Filtered_Frequencies = unique(sort(round(variable,1))); elseif x == 5 F7_Filtered_Frequencies = unique(sort(round(variable,1))); elseif x == 6 F8_Filtered_Frequencies = unique(sort(round(variable,1))); elseif x == 7 Fp1_Filtered_Frequencies = unique(sort(round(variable,1))); elseif x == 8 Fp2_Filtered_Frequencies = unique(sort(round(variable,1))); elseif x == 9 O1_Filtered_Frequencies = unique(sort(round(variable,1))); elseif x == 10 O2_Filtered_Frequencies = unique(sort(round(variable,1))); elseif x == 11 P3_Filtered_Frequencies = unique(sort(round(variable,1))); elseif x == 12 P4_Filtered_Frequencies = unique(sort(round(variable,1))); elseif x == 13 P7_Filtered_Frequencies = unique(sort(round(variable,1))); elseif x == 14 P8_Filtered_Frequencies = unique(sort(round(variable,1))); elseif x == 15 T7_Filtered_Frequencies = unique(sort(round(variable,1))); elseif x == 16 T8_Filtered_Frequencies = unique(sort(round(variable,1))); end end | clear x; clear EEG_Signal; clear variable; clear NFFT; clear Y; clear f; clear BFloor; clear amplitude_variable; clear B; clear IX; |
This creates variables for each EEG placement that contains each of the unique frequencies that were found in the signal. I scanned through them and found that across them, only a few EEG placements recorded frequencies higher than 31.3 Hz – those were F3, Fp2, O1, P3, P8, T7, and T8, which contained the following frequencies: 37.6, 44.9, 45.4, 70.4, 74.8, 79.4, 113.8 Hz.
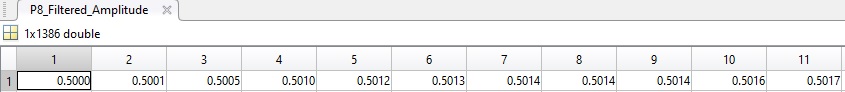
I wanted to source these frequencies in the signal and see the their amplitudes – determine where the were localized. In the segment of code above where we create the variables that hold the Filtered_Frequencies, I modified the above code as follows:
if x == 1
C3_Filtered_Frequencies = round(variable,1);
C3_Filtered_Amplitude = amplitude_variable;
elseif x == 2
C4_Filtered_Frequencies = round(variable,1);
C4_Filtered_Amplitude = amplitude_variable;
elseif x == 3
F3_Filtered_Frequencies = round(variable,1);
F3_Filtered_Amplitude = amplitude_variable;
elseif x == 4
F4_Filtered_Frequencies = round(variable,1);
F4_Filtered_Amplitude = amplitude_variable;
elseif x == 5
F7_Filtered_Frequencies = round(variable,1);
F7_Filtered_Amplitude = amplitude_variable;
elseif x == 6
F8_Filtered_Frequencies = round(variable,1);
F8_Filtered_Amplitude = amplitude_variable;
elseif x == 7
Fp1_Filtered_Frequencies = round(variable,1);
Fp1_Filtered_Amplitude = amplitude_variable;
elseif x == 8
Fp2_Filtered_Frequencies = round(variable,1);
Fp2_Filtered_Amplitude = amplitude_variable;
elseif x == 9
O1_Filtered_Frequencies = round(variable,1);
O1_Filtered_Amplitude = amplitude_variable;
elseif x == 10
O2_Filtered_Frequencies = round(variable,1);
O2_Filtered_Amplitude = amplitude_variable;
elseif x == 11
P3_Filtered_Frequencies = round(variable,1);
P3_Filtered_Amplitude = amplitude_variable;
elseif x == 12
P4_Filtered_Frequencies = round(variable,1);
P4_Filtered_Amplitude = amplitude_variable;
elseif x == 13
P7_Filtered_Frequencies = round(variable,1);
P7_Filtered_Amplitude = amplitude_variable;
elseif x == 14
P8_Filtered_Frequencies = round(variable,1);
P8_Filtered_Amplitude = amplitude_variable;
elseif x == 15
T7_Filtered_Frequencies = round(variable,1);
T7_Filtered_Amplitude = amplitude_variable;
elseif x == 16
T8_Filtered_Frequencies = round(variable,1);
T8_Filtered_Amplitude = amplitude_variable;
end
end
After running the script you’ll find the frequencies found in each of the EEG placements (_Filtered_Frequencies), and their amplitudes (_Filtered_Amplitude).
I wanted to find where these frequencies found inside each of the EEG placements. I ran the code below against each of the EEG placements that had the unique frequencies in them.
| % Find the below frequency in the sample Signal = P8_Filtered_Frequencies; NumberToFind = 70.4; % Routine P8_Matches_70_4 = find(Signal == NumberToFind); clear Signal; clear NumberToFind; | I ran the code to the left and adjusted it to create the different P8_Matches_ variables below: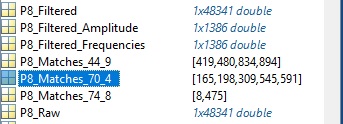 The frequency 70.4 Hz can be found at multiple places in the P8_Matches_70_4 variable. I show the first place (164) below: 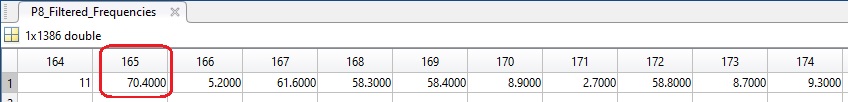 |
A few people have asked me to post my EEG recordings, so I have placed them on GITHUB, here. I will also be moving all of the supporting MATLAB files there as well. Apparently, you are now able to extract silent speech from EEG readings – I wonder if anyone can extract mine?